Clearly, EMT is not competing with R as a statistical package. However, there are many statistical procedures and functions available in EMT too. So EMT may satisfy the basic needs. After all, EMT comes with numerical packages and a computer algebra system.
For details of EMT and statistics, see the tutorial about statistics.
This notebook is for you if you are familiar with R, but need to know the differences of the syntax of EMT and R. We try to give an overview of obvious and less obvious things you need to know.
Moreover, we look at ways to exchange data between the two systems.
Note that this is a work in progress.
The first thing you learn in R is to make a vector. In EMT, the main difference is that the : operator can take a step size. Moreover it has a low binding power.
>n=10; 0:n/20:n-1
[0,  0.5,  1,  1.5,  2,  2.5,  3,  3.5,  4,  4.5,  5,  5.5,  6,  6.5,
7,  7.5,  8,  8.5,  9]
The c() function does not exist. It is possible to use vectors to concatenate things.
The following example is, like many others, from the "Interoduction to R" that comes with the R project. If you read this PDF, you will find that I follow its path in this tutorial.
>x=[10.4, 5.6, 3.1, 6.4, 21.7]; [x,0,x]
[10.4, 5.6, 3.1, 6.4, 21.7, 0, 10.4, 5.6, 3.1, 6.4, 21.7]
The colon operator with step size of EMT is replaced by the function seq() in R. We can write this function in EMT.
>function seq(a,b,c) := a:b:c; ...
 seq(0,-0.1,-1)
[0, -0.1, -0.2, -0.3, -0.4, -0.5, -0.6, -0.7, -0.8, -0.9, -1]
The function rep() of R is not present in EMT. For vector input, it could be written as follows.
>function rep(x:vector,n:index) := flatten(dup(x,n)); ...
 rep(x,2)
[10.4, 5.6, 3.1, 6.4, 21.7, 10.4, 5.6, 3.1, 6.4, 21.7]
Note that "=" or ":=" is used for assignments. The "->" operator is used for units in EMT.
>125km -> " miles"
77.6713990297 miles
The "<-" operator for assignment is misleading anyway, and not a good idea of R. The following will compare a and -4 in EMT.
>a=2; a<-4
0
In R, "a<-4<3" works, but "a<-4<-3" does not. I had similar ambiguities in EMT too, but tried to eliminate them by and by.
EMT and R have vectors of boolean type. But in EMT, the numbers 0 and 1 are used to represent false and true. In R, the values true and false can nevertheless used in ordinary arithmetic just like in EMT.
>x<5, %*x
[0,  0,  1,  0,  0]
[0,  0,  3.1,  0,  0]
EMT throws errors or yields NAN depending on the flag "errors".
>errors off; 0/0, isNAN(sqrt(-1)), errors on;
NAN
1
Strings are the same in R and EMT. Both are in the current locale, not in Unicode.
In R there are packages for Unicode. In EMT, a string can be Unicode string. A unicode string can be translated to the local encoding and vice versa. Moreover, u"..." can contain HTML entities.
>u"© Ren&eacut; Grothmann"
© René Grothmann
The following may or may not display correctly on your system as A with dot and dash above it. It depends on the font you are using.
>chartoutf([480])
Ǡ
The string concatenation is done with "+" or "|". It can include numbers, which will print in the current format.
>"pi = "+pi
pi = 3.14159265359
Most of the time, this will work as in R.
But EMT will interpret negative indices from the back of the vector, while R interprets x[n] as x without the n-th elements.
>x, x[1:3], x[-2]
[10.4,  5.6,  3.1,  6.4,  21.7]
[10.4,  5.6,  3.1]
6.4
The behavior of R can be achieved in EMT with drop().
>drop(x,2)
[10.4, 3.1, 6.4, 21.7]
Logical vectors are not treated differently as index in EMT, in contrast to R. You need to extract the non-zero elements first in EMT.
>x, x>5, x[nonzeros(x>5)]
[10.4,  5.6,  3.1,  6.4,  21.7]
[1,  1,  0,  1,  1]
[10.4,  5.6,  6.4,  21.7]
Just as in R, the index vector can contain repetitions.
>x[[1,2,2,1]]
[10.4, 5.6, 5.6, 10.4]
But names for indices are not possible in EMT. For a statistical package, this may often be necessary to ease access to elements of vectors.
To mimic this behavior, we can define a function as the following.
>function sel (v,i,s) := v[indexof(s,i)]; ...
 s=["first","second","third","fourth"]; sel(x,["first","third"],s)
[10.4, 3.1]
EMT has more fixed data types than R. Obviously, in R there exist growing vectors. You can set an empty numerical vector v and assign a value to the element v[17]. This is not possible in EMT.
The following is a bit inefficient.
>v=[]; for i=1 to 10000; v=v|i; end;
EMT will now construct a vector with v and i appended on the stack and copy that vector back to the global variable v.
The more efficient pre-defines the vector.
>v=zeros(10000); for i=1 to 10000; v[i]=i; end;
To change date types in EMT, you can use functions like complex().
>complex(1:4)
[ 1+0i , 2+0i , 3+0i , 4+0i ]
Conversions to strings is possible for elementary data types only. The current format is used for simple string concatenation. But there are functions like print() or frac().
For vectors, you can easily write your own function.
>function tostr (v) ...
 s="[";
 loop 1 to length(v);
    s=s+print(v[#],2,0);
    if #<length(v) then s=s+","; endif;
 end;
 return s+"]";
 endfunction
>tostr(linspace(0,1,10))
[0.00,0.10,0.20,0.30,0.40,0.50,0.60,0.70,0.80,0.90,1.00]
For communication with Maxima, there exists a function convertmxm(), which can also be used to format a vector for output.
>convertmxm(1:10)
[1,2,3,4,5,6,7,8,9,10]
For Latex and tabular output, there is texprint().
>texprint(random(2,2))
\settabs\+ \qquad \quad & \quad 3.3333e-012 & \quad 3.3333e-012 & \cr
\+ & \hfill 0.65542 & \hfill 0.201 & \cr
\+ & \hfill 0.89362 & \hfill 0.28189 & \cr
And of course the tex command by Latex.
>tex(&[1,2,3])
\left[ 1 , 2 , 3 \right]
In the introduction to R there is an example with so called factors.
The following is a list of the territories of 30 states.
>austates = ["tas", "sa", "qld", "nsw", "nsw", "nt", "wa", "wa", ...
 "qld", "vic", "nsw", "vic", "qld", "qld", "sa", "tas", ...
 "sa", "nt", "wa", "vic", "qld", "nsw", "nsw", "wa", ...
 "sa", "act", "nsw", "vic", "vic", "act"];
Assume, we have corresponding incomes in each state.
>incomes = [60, 49, 40, 61, 64, 60, 59, 54, 62, 69, 70, 42, 56, ...
 61, 61, 61, 58, 51, 48, 65, 49, 49, 41, 48, 52, 46, ...
 59, 46, 58, 43];
Now, we want to compute the mean of incomes in the territories. Being a statistical program, R has factor() and tappy() for this.
EMT can make this by finding the index of territories in the unique list of territories.
>auterr=sort(unique(austates)); f=indexofsorted(auterr,austates)
[6,  5,  4,  2,  2,  3,  8,  8,  4,  7,  2,  7,  4,  4,  5,  6,  5,  3,
8,  7,  4,  2,  2,  8,  5,  1,  2,  7,  7,  1]
At that point, we can write our own loop function to do things for one factor only.
Or we can mimic the tapply() function in the following way.
>function map tappl (i; f$:call, cat, x) ...
 u=sort(unique(cat));
 f=indexof(u,cat);
 return f$(x[nonzeros(f==indexof(u,i))]);
 endfunction
It is a bit inefficient, since it computes The unique territories for each i, but it works.
>tappl(auterr,"mean",austates,incomes)
[44.5, 57.3333, 55.5, 53.6, 55, 60.5, 56, 52.25]
Note that it works for each vector of territories.
>tappl(["act","nsw"],"mean",austates,incomes)
[44.5, 57.3333]
Now, the statistical package of EMT defines tables just as in R. The functions readtable() and writetable() can be used for input and output.
So we can print the average state income in the territories in a friendly way.
>writetable(tappl(auterr,"mean",austates,incomes),labc=auterr,wc=7)
    act    nsw     nt    qld     sa    tas    vic     wa
   44.5  57.33   55.5   53.6     55   60.5     56  52.25
We can also try to mimic the behavior of R completely.
The factors should clearly be kept in a collection with the types and the categories (states and territories in our example). For EMT, we add the pre-computed indices.
>function makef (t) ...
 ## Factor data
 ## Returns a collection with data t, unique data, indices.
 ## See: tapply
 u=sort(unique(t));
 return {{t,u,indexofsorted(u,t)}};
 endfunction
>statef=makef(austates);
Now the third element of the collection will contain the indices.
>statef[3]
[6,  5,  4,  2,  2,  3,  8,  8,  4,  7,  2,  7,  4,  4,  5,  6,  5,  3,
8,  7,  4,  2,  2,  8,  5,  1,  2,  7,  7,  1]
Now we can mimic tapply() in the following way. It will return a table as a collection of table data and column headings.
>function tapply (t:vector,tf,f$:call) ...
 ## Makes a table of data and factors
 ## tf : output of makef()
 ## See: makef
 uf=tf[2]; f=tf[3]; x=zeros(length(uf));
 for i=1 to length(uf);
    ind=nonzeros(f==i);
    if length(ind)==0 then x[i]=NAN;
    else x[i]=f$(t[ind]);
    endif;
 end;
 return {{x,uf}};
 endfunction
We did not add much type checking here. The only precaution concerns categories (factors) with no data. But one should check for the correct length of t and for the correctness of the collection tf.
This table can be printed as a table with writetable().
>writetable(tapply(incomes,statef,"mean"),wc=7)
    act    nsw     nt    qld     sa    tas    vic     wa
   44.5  57.33   55.5   53.6     55   60.5     56  52.25
EMT has only two dimensions for arrays. The data type is called a matrix. It would be easy to write functions for higher dimensions or a C library for this, however.
R has more than two dimensions. In R the array is a vector with a dimension field.
In EMT, a vector is a matrix with one row. It can be made into a matrix with redim().
>shortformat; X=redim(1:20,4,5)
        1         2         3         4         5
        6         7         8         9        10
       11        12        13        14        15
       16        17        18        19        20
Extraction of rows and columns, or sub-matrices, is much like in R.
>X[,2:3]
        2         3
        7         8
       12        13
       17        18
However, in R it is possible to set a list of specific indices of the vector to a value. The same is possible in EMT only with a loop.
>function setmatrixvalue (M, i, j, v) ...
 loop 1 to max(length(i),length(j),length(v))
    M[i{#},j{#}] = v{#};
 end;
 endfunction
We demonstrate this to show that matrices are passed by reference in EMT. If you do not want to change the original matrix M, you need to copy it in the function.
>setmatrixvalue(X,1:3,3:-1:1,0); X,
        1         2         0         4         5
        6         0         8         9        10
        0        12        13        14        15
       16        17        18        19        20
The outer product in EMT can only be done between vectors. It is automatic due to the matrix language. One vector needs to be a column vector and the other a row vector.
>(1:5)*(1:5)'
        1         2         3         4         5
        2         4         6         8        10
        3         6         9        12        15
        4         8        12        16        20
        5        10        15        20        25
In the introduction PDF for R there is an example, which computes the distribution of ab-cd for a,b,c,d chosen from 0 to n randomly. The solution in R is form a 4-dimensional matrix and run table() over it.
Of course, this can be achieved with a loop. But loops are not effective in EMT or R. In EMT, we could write the loop in C and that would be the quickest solution.
But we want to mimic the behavior of R. For this, we need to flatten the multiplications ab and make a matrix of ab-cd.
>a=0:6; b=a'; p=flatten(a*b); q=flatten(p-p'); ...
 u=sort(unique(q)); f=getmultiplicities(u,q); ...
 statplot(u,f,"h"):
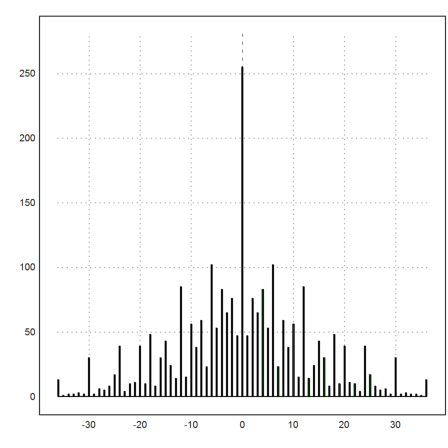
Besides the exact multiplicities, EMT can compute frequencies in vectors.
>getfrequencies(q,-50:10:50)
[0, 23, 132, 316, 602, 801, 333, 141, 53, 0]
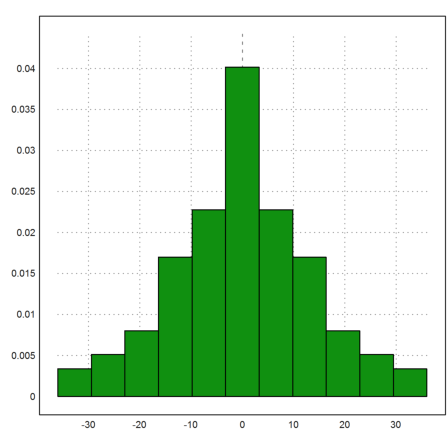
The most easy way to plot this as a distribution is the following.
>plot2d(q,distribution=11):
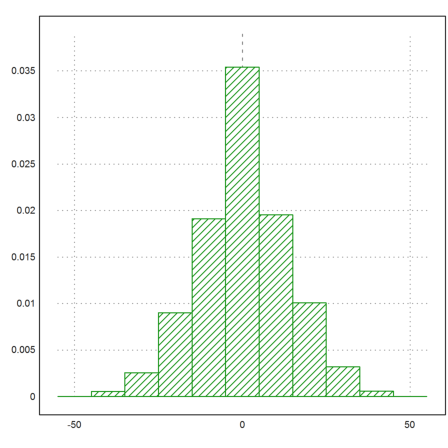
But it is also possible to pre-compute the count in chosen intervals beforehand. Of course, the following uses getfrequencies() internally.
Since the histo() function returns frequencies, we need to scale these so that the integral under the bar graph is 1.
>{x,y}=histo(q,v=-55:10:55); y=y/sum(y)/differences(x); ...
 plot2d(x,y,>bar,style="/"):
EMT has two sorts of lists. One is a global list which is mutable, and the other is a list type which is immutable. We do not care about global lists here.
The immutable list type is called a collection in EMT. It behaves like a structure in C, but the elements are just numbered and not named.
>L={{"Fred","Flintstone",40,[1990,1992]}}
Fred
Flintstone
40
[1990,  1992]
Currently the elements do not have names, though names can be set for special purposes. They are accessed by numbers.
>(L[4])[2]
1992
This is described in detail in other tutorials. Simple functions are writematrix() and readmatrix().
For statics, EMT can read and write tables.
>file=eulerhome()+"test.dat"; open(file,"w"); ...
 writeln("A,B,C"); writematrix(random(3,3)); ...
 close();
The file looks like this.
>printfile(file)
A,B,C
0.4453627564273003,0.3084110353211584,0.9145409086421026
0.1935854779811416,0.4633868194128757,0.0951529788263157
0.5950170162024192,0.4311837813121366,0.7286804774486648
The function readtable() in its simplest form can read this and return a collection of values and heading lines.
>L=readtable(file,>list);
This collection can be printed with writetable() to the notebook, or to a file.
>writetable(L,wc=10,dc=5)
         A         B         C
   0.44536   0.30841   0.91454
   0.19359   0.46339   0.09515
   0.59502   0.43118   0.72868
The matrix of values is the first element of L. Note that mean() in EMT computes the mean values of the rows of a matrix.
>mean(L[1])
 0.556105
 0.250708
  0.58496